Intermittent Fasting Electrolyte Depletion and Sweat Rate Formula: Complete Scheduling & Dosing Math
Scheduling daily hydration and mineral replenishment across a structured fasting window requires accounting for two parallel loss pathways: baseline non-exercise urinary excretion and physical activity sweat rate. When individuals transition into an \( 16:8 \), \( 18:6 \), or \( 20:4 \) schedule—or extend their fasting interval to \( 24\text{ h} \) to \( 48\text{ h} \)—fluid and mineral logistics shift predictably. Without a quantitative model linking fasting duration, sweat volume, and compound salt mass, drinking large volumes of plain water dilutes ambient mineral concentration rather than restoring equilibrium. This technical guide derives the complete multi-variable depletion equation, establishes exact protocol dosing benchmarks from \( 2{,}000\text{ mg} \) to \( 5{,}000\text{ mg} \) of sodium per day, and converts elemental targets into exact gram weights of standard kitchen and bulk salts.
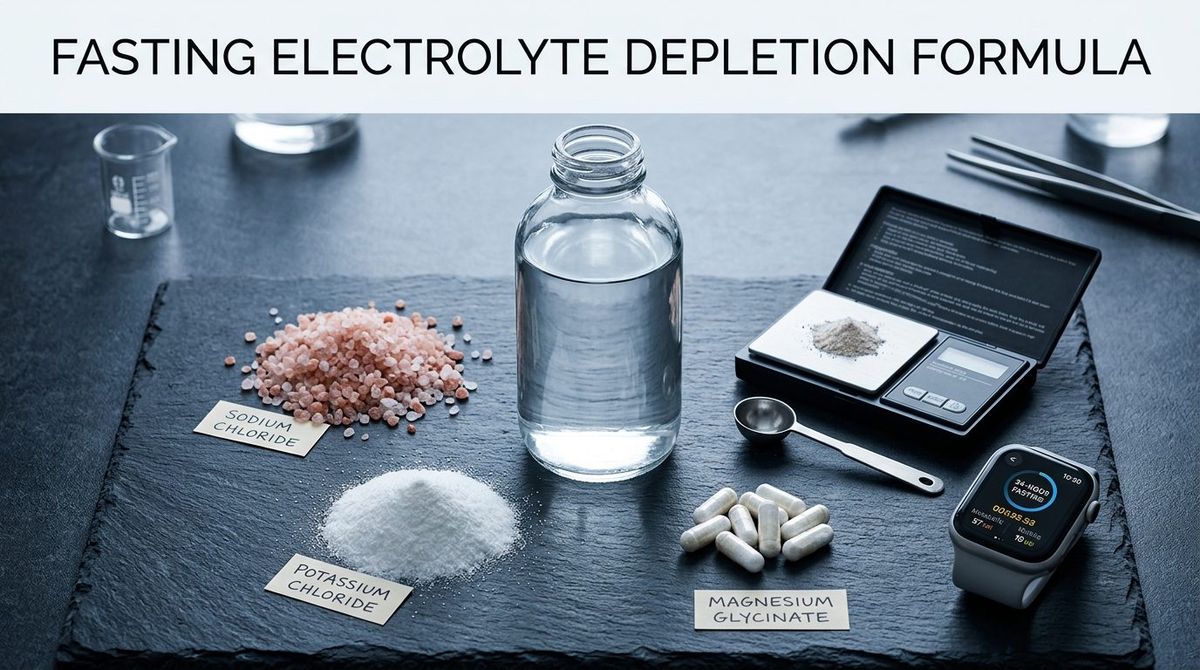
The Multi-Variable Electrolyte Depletion Formula
Total elemental sodium depletion \( D_{\text{Na}} \) (expressed in milligrams) across any scheduled fasting window is the sum of cumulative baseline excretion over the fasting hours plus exercise-induced sweat losses accrued during training sessions:
\[ D_{\text{Na}} = \left( t_{\text{fast}} \times r_{\text{renal}} \right) + \sum_{i=1}^{n} \left( t_{\text{train},i} \times R_{\text{sweat},i} \times C_{\text{Na,sweat}} \right) \]Each parameter in the scheduling equation represents a measurable physical rate:
- Scheduled Fasting Window Duration \( \left( t_{\text{fast}} \right) \): The continuous elapsed hours between the close of the final meal in the prior eating window and the opening meal of the next window, such as \( 16\text{ hr} \), \( 20\text{ hr} \), or \( 36\text{ hr} \).
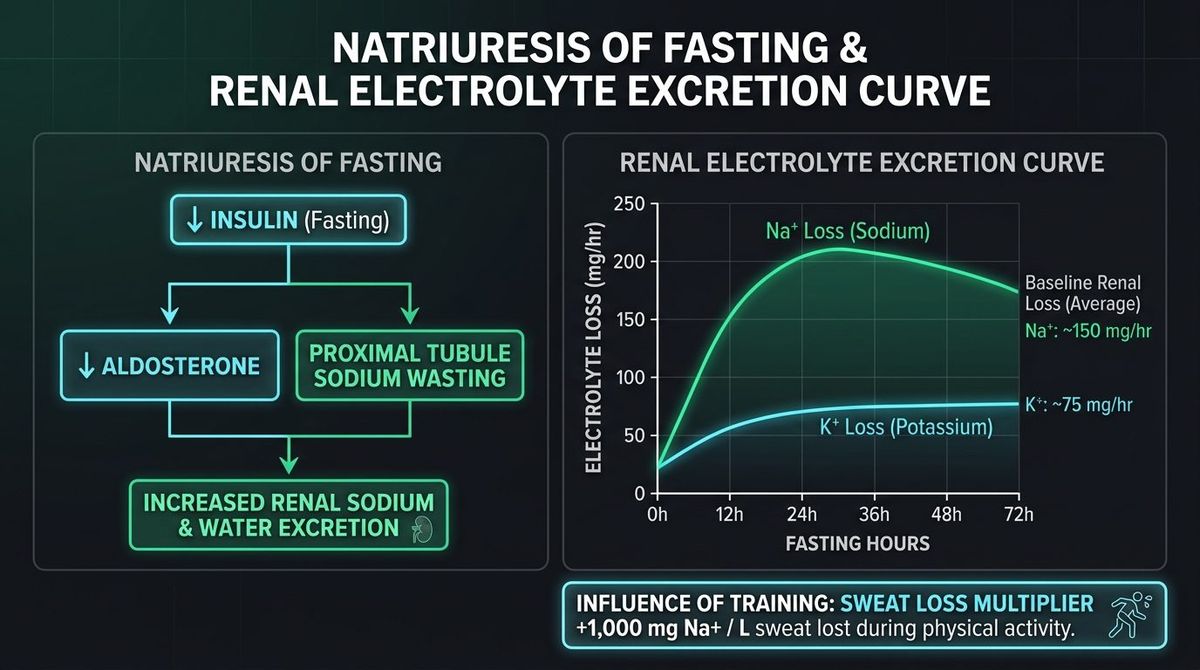
- Baseline Hourly Excretion Rate \( \left( r_{\text{renal}} \right) \): The non-exercise urinary mineral loss rate during fasting hours. Across a standard \( 20\text{ hr} \) daily protocol, conservative baseline modeling uses \( r_{\text{renal}} = 120\text{ mg/hr} \) for sodium, while the 72-hour excretion curve averages approximately \( \sim 150\text{ mg/hr} \) for sodium \( \left( \text{Na}^+ \right) \) and \( \sim 75\text{ mg/hr} \) for potassium \( \left( \text{K}^+ \right) \) as urinary output peaks between \( 24\text{ h} \) and \( 36\text{ h} \).
- Training Session Duration \( \left( t_{\text{train},i} \right) \): The active exercise or thermal exposure time in hours for session \( i \).
- Volumetric Sweat Rate \( \left( R_{\text{sweat},i} \right) \): The fluid volume lost per hour of physical activity, measured in liters per hour \( \left( \text{L/hr} \right) \) by weighing body mass before and after a session where \( 1.0\text{ kg} \) of mass delta equals \( 1.0\text{ L} \) of sweat.
- Sweat Sodium Concentration \( \left( C_{\text{Na,sweat}} \right) \): The milligrams of elemental sodium per liter of sweat. Standard endurance benchmarks average \( 950\text{ mg/L} \) to \( 1{,}000\text{ mg/L} \) of \( \text{Na}^+ \) per liter of sweat lost during physical activity or heavy heat exposure.
Worked Calculation: 20:4 Active Protocol with 1 Hour of Training
Consider an athlete or operator following a daily \( 20:4 \) intermittent fasting schedule \( \left( t_{\text{fast}} = 20\text{ hr} \right) \) who completes a single \( 1.0\text{ hr} \) conditioning session \( \left( t_{\text{train}} = 1.0\text{ hr} \right) \) inside the fasted window. Pre- and post-session scale checks confirm a volumetric sweat rate of \( R_{\text{sweat}} = 0.85\text{ L/hr} \) to \( 1.0\text{ L/hr} \) at a measured sweat concentration of \( C_{\text{Na,sweat}} = 950\text{ mg/L} \) to \( 1{,}000\text{ mg/L} \).
Using the conservative case study parameters \( \left( r_{\text{renal}} = 120\text{ mg/hr} \text{ over } 20\text{ hr} \text{ and } 950\text{ mg} \text{ sweat loss} \right) \), baseline non-exercise sodium output across the \( 20\text{ hr} \) window is:
\[ D_{\text{Na,baseline}} = 20\text{ hr} \times 120\text{ mg/hr} = 2{,}400\text{ mg} \]Adding the \( 1.0\text{ hr} \) training sweat loss of \( 950\text{ mg} \) (or \( 1{,}000\text{ mg} \) at the full \( +1{,}000\text{ mg/L} \) sweat multiplier) yields the total fasting-window sodium deficit:
\[ D_{\text{Na,total}} = 2{,}400\text{ mg} + 950\text{ mg} = 3{,}350\text{ mg} \]When evaluated at the higher \( \sim 150\text{ mg/hr} \) multi-day curve average plus \( 1{,}000\text{ mg/L} \) for \( 1\text{ hr} \) of heavy sweat, the 20:4 active requirement scales to \( \left( 20\text{ hr} \times 150\text{ mg/hr} \right) + 1{,}000\text{ mg} = 4{,}000\text{ mg} \), framing the exact \( 3{,}500\text{ mg} \) to \( 4{,}000\text{ mg} \) daily target bracket for a \( 20:4 \) Active schedule.
Potassium-to-Sodium Ratio and Magnesium Co-Factor Math
Scheduling sodium in isolation leaves intracellular potassium and magnesium balances unaddressed. To maintain consistent ratio logistics across both fasting and feeding windows, total daily potassium target \( D_{\text{K}} \) is modeled as a fixed proportion of total sodium turnover plus direct sweat potassium loss \( \left( C_{\text{K,sweat}} \approx 200\text{ mg/L} \right) \):
\[ D_{\text{K}} = D_{\text{Na}} \times \left( \frac{\text{K}}{\text{Na}} \right)_{\text{target}} \]Using a target intracellular-to-extracellular replenishment ratio of \( \text{K}:\text{Na} = 0.65:1 \) to \( 0.75:1 \), a daily sodium schedule of \( 3{,}350\text{ mg} \) to \( 4{,}000\text{ mg} \) pairs with \( 2{,}178\text{ mg} \) to \( 2{,}500\text{ mg} \) of elemental potassium and \( 300\text{ mg} \) to \( 400\text{ mg} \) of elemental magnesium \( \left( \text{Mg}^{2+} \right) \) (specifically \( 380\text{ mg} \) on a \( 20:4 \) Active schedule). Across all standard intermittent and extended protocols, the core daily ion brackets span \( 3{,}000\text{ mg} \) to \( 5{,}000\text{ mg} \) for sodium \( \left( \text{Na}^+ \right) \), \( 2{,}500\text{ mg} \) to \( 3{,}500\text{ mg} \) for potassium \( \left( \text{K}^+ \right) \), and \( 300\text{ mg} \) to \( 400\text{ mg} \) for magnesium \( \left( \text{Mg}^{2+} \right) \).
Fasting Electrolyte Dosing Matrix by Protocol and Activity
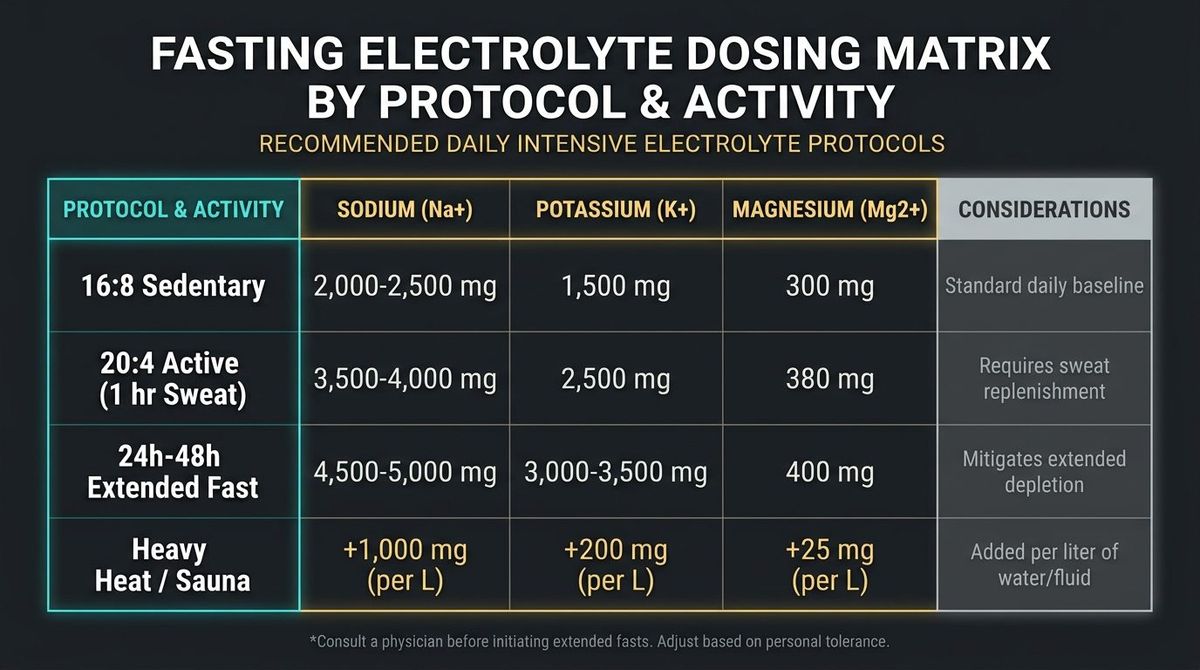
The reference table below consolidates the exact daily elemental targets across the four primary scheduling and environmental tiers so you can match your timer settings directly to your daily mineral budget:
| Protocol & Activity Tier | Sodium \( \left( \text{Na}^+ \right) \) | Potassium \( \left( \text{K}^+ \right) \) | Magnesium \( \left( \text{Mg}^{2+} \right) \) | Scheduling Considerations |
|---|---|---|---|---|
| 16:8 Sedentary | \( 2{,}000\text{--}2{,}500\text{ mg} \) | \( 1{,}500\text{ mg} \) | \( 300\text{ mg} \) | Standard daily baseline split between fasted morning water and 8-hour feeding window |
| 20:4 Active (1 hr Sweat) | \( 3{,}500\text{--}4{,}000\text{ mg} \) | \( 2{,}500\text{ mg} \) | \( 380\text{ mg} \) | Requires pre- and post-training sweat replenishment inside the 20-hour fast |
| 24h–48h Extended Fast | \( 4{,}500\text{--}5{,}000\text{ mg} \) | \( 3{,}000\text{--}3{,}500\text{ mg} \) | \( 400\text{ mg} \) | Mitigates peak 24h–36h urinary excretion without caloric intake |
| Heavy Heat / Sauna Multiplier | \( +1{,}000\text{ mg/L} \) | \( +200\text{ mg/L} \) | \( +25\text{ mg/L} \) | Added per liter \( \left( 1.0\text{ L} \right) \) of sweat/fluid lost during thermal or endurance sessions |
Stoichiometric Conversion: Elemental Milligrams to Kitchen Salt Grams
Nutrition labels and dosing tables specify elemental ion mass, whereas digital kitchen scales measure total compound crystal weight. Because chloride, citrate, or glycinate ions make up the remainder of the molecular weight, weighing \( 3{,}350\text{ mg} \) of table salt on a scale delivers less than half of the required elemental sodium. Use the molecular mass fraction equations below to convert elemental targets into exact scale weights.
1. Sodium Chloride \( \left( \text{NaCl} \right) \) Conversion Math
Pure sodium chloride has a molar mass of \( 58.44\text{ g/mol} \), composed of elemental sodium \( \left( 22.99\text{ g/mol} \right) \) and chloride \( \left( 35.45\text{ g/mol} \right) \). The elemental sodium mass fraction \( f_{\text{Na}} \) is:
\[ f_{\text{Na}} = \frac{22.99\text{ g/mol}}{58.44\text{ g/mol}} = 0.3934 \quad \left( 39.34\% \text{ Na} \right) \]To obtain \( 3{,}350\text{ mg} \) of elemental sodium from fine sea salt or table salt, divide the elemental requirement by \( 0.3934 \):
\[ m_{\text{NaCl}} = \frac{3{,}350\text{ mg}}{0.3934} = 8{,}515.5\text{ mg} \approx 8.52\text{ g of NaCl} \]Similarly, reaching the \( 4{,}000\text{ mg} \) upper bound of the \( 20:4 \) Active tier requires \( \frac{4{,}000\text{ mg}}{0.3934} = 10.17\text{ g} \) of pure \( \text{NaCl} \) across the 24-hour cycle.
2. Potassium Chloride \( \left( \text{KCl} \right) \) Conversion Math
Food-grade potassium chloride powder (often sold as salt substitute) has a molar mass of \( 74.55\text{ g/mol} \), composed of elemental potassium \( \left( 39.10\text{ g/mol} \right) \) and chloride \( \left( 35.45\text{ g/mol} \right) \). The elemental potassium mass fraction \( f_{\text{K}} \) is:
\[ f_{\text{K}} = \frac{39.10\text{ g/mol}}{74.55\text{ g/mol}} = 0.5245 \quad \left( 52.45\% \text{ K} \right) \]To supply \( 2{,}500\text{ mg} \) of elemental potassium on a \( 20:4 \) Active schedule (or if accounting for \( 1{,}000\text{ mg} \) from whole-food meals during the 4-hour eating window and \( 1{,}500\text{ mg} \) from fasted hydration), the required compound weight is:
\[ m_{\text{KCl,total}} = \frac{2{,}500\text{ mg}}{0.5245} = 4{,}766.4\text{ mg} \approx 4.77\text{ g of KCl} \] \[ m_{\text{KCl,fasted}} = \frac{1{,}500\text{ mg}}{0.5245} = 2{,}859.9\text{ mg} \approx 2.86\text{ g of KCl} \]3. Magnesium Glycinate and Citrate Conversion Math
Magnesium glycinate typically contains \( 14.1\% \) elemental magnesium by weight \( \left( f_{\text{Mg,gly}} = 0.141 \right) \), while anhydrous magnesium citrate contains \( 16.2\% \) elemental magnesium \( \left( f_{\text{Mg,cit}} = 0.162 \right) \). Achieving the \( 380\text{ mg} \) elemental target for the \( 20:4 \) Active protocol requires:
\[ m_{\text{MgGly}} = \frac{380\text{ mg}}{0.141} = 2{,}695\text{ mg} \approx 2.70\text{ g of Magnesium Glycinate} \]Hourly Hydration Pacing & Osmolarity Ceiling
Bolus-dosing an entire day's salt allocation in a single glass of water creates a hypertonic solution in the gastrointestinal tract, drawing water into the lumen and accelerating transit rather than absorption. To maintain isotonic-to-mildly-hypotonic fluid delivery during the fasting window, cap sodium concentration per liter of drinking water at \( C_{\text{drink}} \le 1{,}000\text{ mg/L} \) to \( 1{,}200\text{ mg/L} \) (roughly \( 2.5\text{ g} \) to \( 3.0\text{ g} \) of \( \text{NaCl} \) per \( 1.0\text{ L} \) bottle).
Split the fasted-window mineral budget into three or four scheduled hydration blocks spaced every \( 4\text{ hr} \) to \( 5\text{ hr} \):
- Block 1 (Hours 0–6 of Fast): Residual meal absorption covers baseline turnover; drink \( 0.5\text{ L} \) of water with \( 500\text{ mg} \) \( \text{Na}^+ \) and \( 300\text{ mg} \) \( \text{K}^+ \).
- Block 2 (Hours 6–12 / Morning Awakening): Counter overnight fluid loss with \( 0.75\text{ L} \) water containing \( 1{,}000\text{ mg} \) \( \text{Na}^+ \) and \( 500\text{ mg} \) \( \text{K}^+ \).
- Block 3 (Hours 12–16 / Pre- & Intra-Workout Window): Consume \( 1.0\text{ L} \) water formulated with the full \( +1{,}000\text{ mg} \) \( \text{Na}^+ \) and \( +200\text{ mg} \) \( \text{K}^+ \) sweat multiplier across the \( 60\text{ min} \) training block.
- Block 4 (Hours 16–20 / Final Fasted Stretch & Eating Window): Deliver the remaining \( 1{,}000\text{ mg} \) to \( 1{,}500\text{ mg} \) \( \text{Na}^+ \), \( 1{,}500\text{ mg} \) \( \text{K}^+ \) via whole foods inside the 4-hour feeding window, and \( 380\text{ mg} \) elemental \( \text{Mg}^{2+} \) sixty minutes prior to sleep.